A congratulatory report on a country that is winning at everything except the things that compound.
A data essay. Every number below is sourced to a government reply, a court judgment, a peer-reviewed paper, or a named survey. Where the picture is genuinely good, it says so. Where the fault predates the current government, it says that too. The argument is not that India is failing. It is that we have learned to measure the wrong things, celebrate them loudly, and call the silence around everything else “growth.”
I. Congratulations, we are the fastest-growing major economy
And we are. That part is true and worth saying without a sneer: real GDP has run at roughly 6.4–7.6% across FY24–FY26, nominal GDP has crossed $3.9 trillion, and GST collections touched about ₹19.35 lakh crore in FY25–26.1 India genuinely is the fastest-growing major economy. Hold that thought, because everything that follows is not a denial of it - it is a question about who is in the photograph.
Here is the thing the headline number cannot see: the median Indian’s wage.
Economists Arindam Das and Jean Drèze, using the Labour Bureau’s own Wage Rates in Rural India series, found that real rural wages grew nearly 7% a year between 2010-11 and 2015-16 - and then collapsed to roughly zero.2 Nominal agricultural wages rose about 6% a year from 2014 to 2024; adjusted for inflation, that becomes about 1%. Over the same decade, per-capita income grew about 4.6% in real terms.2 So the economy nearly quintupled the pace at which it created output relative to the pace at which it paid the person doing the work.
Meanwhile, at the top: corporate profits at India’s largest listed companies rose 22.3% in FY24, while employment at those same companies grew 1.5%.3 The profit-to-GDP ratio for the Nifty 500 hit 4.8% - the highest since FY08, the year before the global financial crisis.3
This is what economists at Ashoka University’s CEDA and the World Inequality Report 2026 call a K-shaped economy: two lines leaving the same point, one going up, one going flat, both technically part of “the recovery.”4 The aggregate is real. The distribution is the story. GDP is a photograph taken from far enough away that everyone looks like they’re smiling.
The honest caveat: jobless growth is not a Modi-era invention. The term itself describes India since the 1991 liberalisation - employment elasticity has been falling for thirty years as growth concentrated in capital-intensive services that don’t hire at scale.5 This government inherited the pattern. What it did was perfect the marketing of the aggregate while the wage line went flat underneath it.
II. The part where we discuss the children, because that is the part that compounds
If wages are the present tense, learning is the future tense - and the future tense is where the real bill is being run up.
Here is the single number this whole essay is organised around. According to ASER 2024 - Pratham’s Annual Status of Education Report, the most respected learning survey in the country - only 27.1% of Class 3 children can read a Class 2-level text.6 The picture is worse in government schools specifically, where the figure is 23.4%. Nationally, only 33.7% of Class 3 children can do subtraction. By Class 5, government-school figures show 44.8% reading at the Class 2 benchmark and 30.7% able to divide.6
Read that again slowly. After three years of school, only about one in four children can read the textbook meant for the grade below them - and in the government schools that serve the poorest, closer to one in five.
We have near-universal enrolment - about 98% for the 6-14 age group, and it’s been above 95% for nearly two decades.7 We built that, and it is a genuine achievement. But enrolment measures whether a child is in the building. It says nothing about whether learning is happening inside it. And here’s the tell: enrolment is now so uniformly high across states that it has stopped distinguishing good school systems from bad ones - it carries almost no information - while the learning numbers vary enormously. We optimised the metric we could photograph - bums on seats - and declared the mission accomplished, because “enrolment” is the number that goes in the brochure. (This isn’t just rhetoric; it’s measurable, and the companion study quantifies exactly how saturated the proxy has become.)
The honest caveat, twice over: First, ASER 2024 is not all bleak - it recorded the biggest improvement in the report’s 20-year history, driven by government schools and the NEP 2020 foundational-literacy push.8 Real, ground-level, worth crediting. Second - and this cuts the other way - India’s own government learning survey, the NAS, is statistically unreliable even for comparing states, per peer-reviewed work by Johnson and Parrado.9 So when the official machinery reports its own progress, treat it the way you’d treat a student grading their own exam.
Then the assembly line moves the under-read child forward anyway, and eventually hands them a degree.
- 80% of Indian engineering graduates were rated unemployable in the widely-cited Aspiring Minds employability work.10
- 83% of 2024 engineering graduates remained without a job or internship, per the Unstop Talent Report 2025 - even as the India Skills Report rated 71.5% of them “job-ready.”11
- Fewer than 7% of male graduates secured a permanent salaried job within a year of graduating in 2023, per Azim Premji University’s State of Working India 2026.12
“Employable on paper, unemployed in fact” is not a paradox. It is the exact shape you get when a system teaches to an exam, rewards the certificate, and never checks whether anything underneath the certificate is load-bearing. We built a culture that defines success as the credential rather than the capability the credential is supposed to certify. The gap between those two things is the whole crisis, and it starts in Class 3.
This is the “wrong definition of success” made numeric. And it is largely - though not entirely - a cultural and institutional failure that no single government created and no single government can absolve itself of either.
III. So the best ones leave. Specifically, the best ones.
Here is where the essay stops being about averages and becomes about the tail - because the tail is what a country actually runs on.
A peer-reviewed study in the Journal of Development Economics (Ganguli et al., also an NBER paper) tracked IIT entrance-exam scorers. Among the top 1,000 JEE scorers, about 36% migrate abroad. Among the top 100, it’s 62%. Among the top 10 - nine out of ten.13 Migration doesn’t just rise with education; it rises with ability. The better you are, the more likely India loses you.
It’s not only students. Roughly a third of newly-qualified MBBS physicians emigrate annually, concentrated among the top colleges.14 India has about 3.12 million highly-educated migrants across the OECD - the largest such stock of any country, ahead of China.15 Student outflow went from 7.5 lakh in 2022 to 13.3 lakh in 2024, per the External Affairs Minister’s own reply in the Lok Sabha.16
And the money leaves with the minds. Per Henley & Partners, India lost about 5,100 dollar-millionaires in 2023 and a projected ~3,500 in 2025, taking roughly $26 billion with them.17 (Honest caveat: that annual number is falling, and India’s ultra-wealthy population is still growing off a rising base per Knight Frank - so this is a leak, not a haemorrhage.18)
The drivers are not mysterious and they are not primarily about patriotism. IIT starting salaries of ₹20–30 lakh versus $150k+ for the equivalent Silicon Valley role. Quality of life - pollution, infrastructure, safety, an HDI rank near 134th. Tax and regulatory friction versus the UAE’s zero-income-tax golden visa. And, tellingly, the education of their own children - the wealthy leave partly so their kids can access the schooling this essay’s Section II describes.19 The people best positioned to judge the Indian system are voting against it with their feet, and taking their capital and their children with them.
IV. The joke that isn’t funny: we build the AI industry. Just not here.
Now put Section III next to the defining technology race of the decade, and you get the sharpest illustration of the entire thesis.
On the Stanford 2025 Global AI Vibrancy index, the United States scores 78.6, China 36.95, and India 21.59.20 India ranks roughly third overall - a real, creditable position driven by talent and adoption - but the gap to the top two is an order of magnitude, and India has no home-grown frontier model in the league of OpenAI, DeepMind, Anthropic, or DeepSeek. Sovereign compute under the IndiaAI Mission reached about 38,000 GPUs in mid-2025, targeting 100,000 public GPUs by end-2026.21 For scale: a single US frontier cluster is 100,000+ GPUs, and xAI is targeting a million.22 India was at near-zero sovereign compute until 2024.
Now the punchline. Per the National Foundation for American Policy (2026), India is the #1 country of origin for immigrant founders of US unicorns - 96 companies, ahead of Israel (60), the UK (47), and China (41).23 In AI specifically, the Institute for Progress found 60% of top US AI companies have at least one immigrant founder, and among them India leads with nine founders, ahead of China’s eight.24 Perplexity’s Aravind Srinivas is the flagship. And 70%+ of these immigrant AI founders first arrived in America on a student visa.24
So: India produces the founding talent of the American AI industry - the frontier it is itself an order of magnitude behind - and then cannot retain, fund, or employ that talent at home. The top-100 IIT scorers from Section III and the AI-50 founders here are, substantially, the same people. We are not losing the AI race despite our talent. We are losing it by exporting exactly the talent that would win it.
(Honest caveat, because it matters: Stanford’s VC Initiative notes India’s per-capita “unicorn productivity” is low - 90+ founders in absolute terms, the world’s highest, but only ~2.5 per 100k first-generation immigrants versus Israel’s 43.25 It’s a volume story, not a density story. The point stands regardless: the volume is walking out the door.)
V. The root cause nobody wants to fund: research
Why does the talent leave and the frontier stay abroad? Follow the money that isn’t spent.
India’s Gross Expenditure on R&D has been stuck at about 0.64% of GDP - per the Economic Survey 2025-26 - versus China’s 2.4%, the US’s 3.5%, South Korea’s 4.9%, Israel’s 5.6%, and a world average near 1.8%.26 The damning framing is not that it’s low. It’s that it fell - from about 0.90% in 2008.27 As GDP grew, the share we bet on the future shrank.
The gap is private-sector: Indian business funds about 36% of R&D, versus 75–79% in the US, China, and Korea.28 The Chief Economic Adviser’s own diagnosis, citing Lazonick’s work on financialisation, is blunt - Indian corporates learned to do American-style buybacks and dividends before they built manufacturing and research depth. Premature financialisation: we financialised the economy before we industrialised the knowledge base.29
And the human cost lands right back on Section III: India has 262 researchers per million people, versus South Korea’s 8,714.30 We produce ~40,000 PhDs a year and have ~85,000 researchers working abroad.30
The honest caveat: the government has responded - the Anusandhan National Research Foundation (ANRF), a ~$10 billion, five-year vehicle, and a ₹1 lakh crore RDI fund.31 Real policy. But here’s the reality check that punctures the press release: of the previous year’s RDI allocation, only about 15% was actually spent.32 The problem isn’t only that we don’t allocate. It’s that we can’t deploy what we do allocate. You cannot fix a research culture with a fund you don’t disburse.
VI. Where the money in the room actually comes from
You’ll notice this essay has been careful. It credits UPI (genuinely world-leading real-time payment volume), BHASHINI (hundreds of millions of inferences a month across 22 languages), ISRO, and India’s rise to third-largest producer of scholarly publications.33 These are real, ground-level, built things - not press releases. Give credit where output exists.
But you asked how much the government is responsible, and honesty requires naming the part that is not culture or inheritance or global economics - the part that is a choice. So here is the most defensible “corruption trail” available, and it is defensible precisely because none of it is my allegation. It is the Supreme Court’s finding and the government’s own data.
The Electoral Bonds scheme. On 15 February 2024, a unanimous five-judge Constitution Bench of the Supreme Court struck down the electoral bonds scheme - introduced by this government in 2017 - as unconstitutional, holding that anonymous corporate political funding violated voters’ right to information under Article 19(1)(a).34 The court ordered the data disclosed. When it was, the numbers were these: at its peak the scheme accounted for about 56% of all political funding in the country;35 the BJP received about 48% of all bond donations across 20 major parties, and by one ADR analysis nearly 90% of corporate bond donations, from a scheme worth roughly ₹16,518 crore.36 The court explicitly warned the design could enable “quid pro quo.”37 This is not an op-ed. It is a judgment.
The enforcement asymmetry. Part of this is entirely self-documenting, because it comes from the government’s replies to its own Parliament. The Enforcement Directorate registered 193 cases against politicians over ten years and secured convictions in two.38 Across all PMLA cases, the conviction rate since 2019 is under 5% - 42 of 911 cases.39 Those are the state’s own numbers. What the state pointedly does not publish is the party-wise breakdown: the Ministry of Finance told Parliament it keeps no record of whether the accused were ruling-party or opposition. That gap is filled by others - an Indian Express investigation and a plea by 14 opposition parties to the Supreme Court, which found the share of ED and CBI cases targeting opposition politicians rose from about 54% before 2014 to roughly 95% after.40 Treat those two things at their true weight: the near-total non-conviction is government data; the 95%-opposition figure is journalism and litigation, not a government admission - though the government’s refusal to release the breakdown that would confirm or refute it is telling in its own right. What both point to is an agency that almost never convicts, where the PMLA’s near-impossible bail provisions mean the process is the punishment, regardless of the verdict that rarely comes.
The institutional scoreboard. V-Dem reclassified India from a liberal democracy (2014) to an “electoral autocracy” (by 2020) and records about a 20% decline in judicial-autonomy indicators over 2014-2024.41 Freedom House downgraded India from “Free” to “Partly Free” in 2021.42 RSF’s press-freedom rank fell from 150 to 161 of 180.43 The Journal of Democracy’s scholarly framing is the sharpest: the legal right to dissent remains on the books while the practical possibility of dissent free from harassment has, in their words, largely disappeared.44
The scrupulously honest caveat, because you asked for it and because it’s true: India has suspended civil liberties far more severely before. The Emergency (1975-77) was a formal suspension of democracy, with the press censored by law and opposition leaders jailed en masse. Sedition law (IPC 124A) has been abused by governments of every stripe since independence. The institutions were never as pristine as nostalgia pretends. What the data describes now is not unprecedented in kind - it is a gradual, deniable version of older authoritarian instincts, conducted through agencies and funding structures rather than a declared Emergency. That makes it harder to see, easier to defend, and in some ways more durable. It is worse in its sophistication, not necessarily its severity.
VII. So what is “Successful India”?
It is a country that:
- grew its GDP faster than almost anyone and its median wage barely at all;
- put nearly every child in school and left roughly three in four of them reading below their grade;
- produced the best engineering and AI talent on earth and exported it to build someone else’s frontier;
- spent 0.64% of GDP on the future and couldn’t spend even that;
- and then documented the erosion of its own accountability institutions so thoroughly that the evidence comes from its own courts and its own Parliament.
None of this is a claim that India is failing, or that one party broke a working machine. Much of it is cultural, much of it is inherited, much of it predates 2014 and would outlast any single government. The point is narrower and, I think, harder to dismiss:
We have become extraordinarily good at producing numbers that look like success, and extraordinarily reluctant to measure the things that actually compound - learning, wages, retained talent, research, and the health of the institutions that keep power honest. GDP was always going to grow; it was the one number guaranteed to rise regardless. We chose it as the scoreboard precisely because it flatters us, and we look away from the Class 3 reading level precisely because it doesn’t.
The children who can’t read the grade-2 textbook are eight years old. In 2040, when the demographic dividend window closes, they’ll be twenty-two. That is the actual deadline. Everything else is a photograph.
VIII. The proxy gap, tested
The essay above is the argument. This is where the argument submits to the possibility of being wrong.
I operationalised one of its central claims as a small data-science study:
Once a visible proxy is saturated, does it still distinguish the underlying capability it is supposed to represent?
Education is the cleanest test. The proxy is rural school enrolment among children aged 6–14. The capability measure is the share of Class 3 children who can read a Class 2 text. Both come from ASER 2024, matched across the complete set of 27 published state and union-territory panels.
For each row, the analysis pairs:
| Construct | Measure | Source |
|---|---|---|
| Access proxy | Children aged 6–14 enrolled in school | ASER State Table 1 |
| Capability | Class 3 children able to read a Class 2 text | ASER State Table 4 |
| Descriptive wedge | Enrolment minus reading, in percentage points | Derived |
What came back
- Enrolment is compressed into a 95.9%–99.9% range.
- Foundational reading spans 6.2%–50.6% across the same 27 states and UTs.
- Reading’s coefficient of variation is about 37 times enrolment’s.
- Pearson’s correlation is r = 0.11; a fixed-seed permutation test gives p = 0.59.
- The bootstrap 95% interval for the correlation is −0.23 to 0.44.
- Spearman’s rank correlation is effectively zero (ρ = −0.003), and the simple linear model has R² = 0.012.
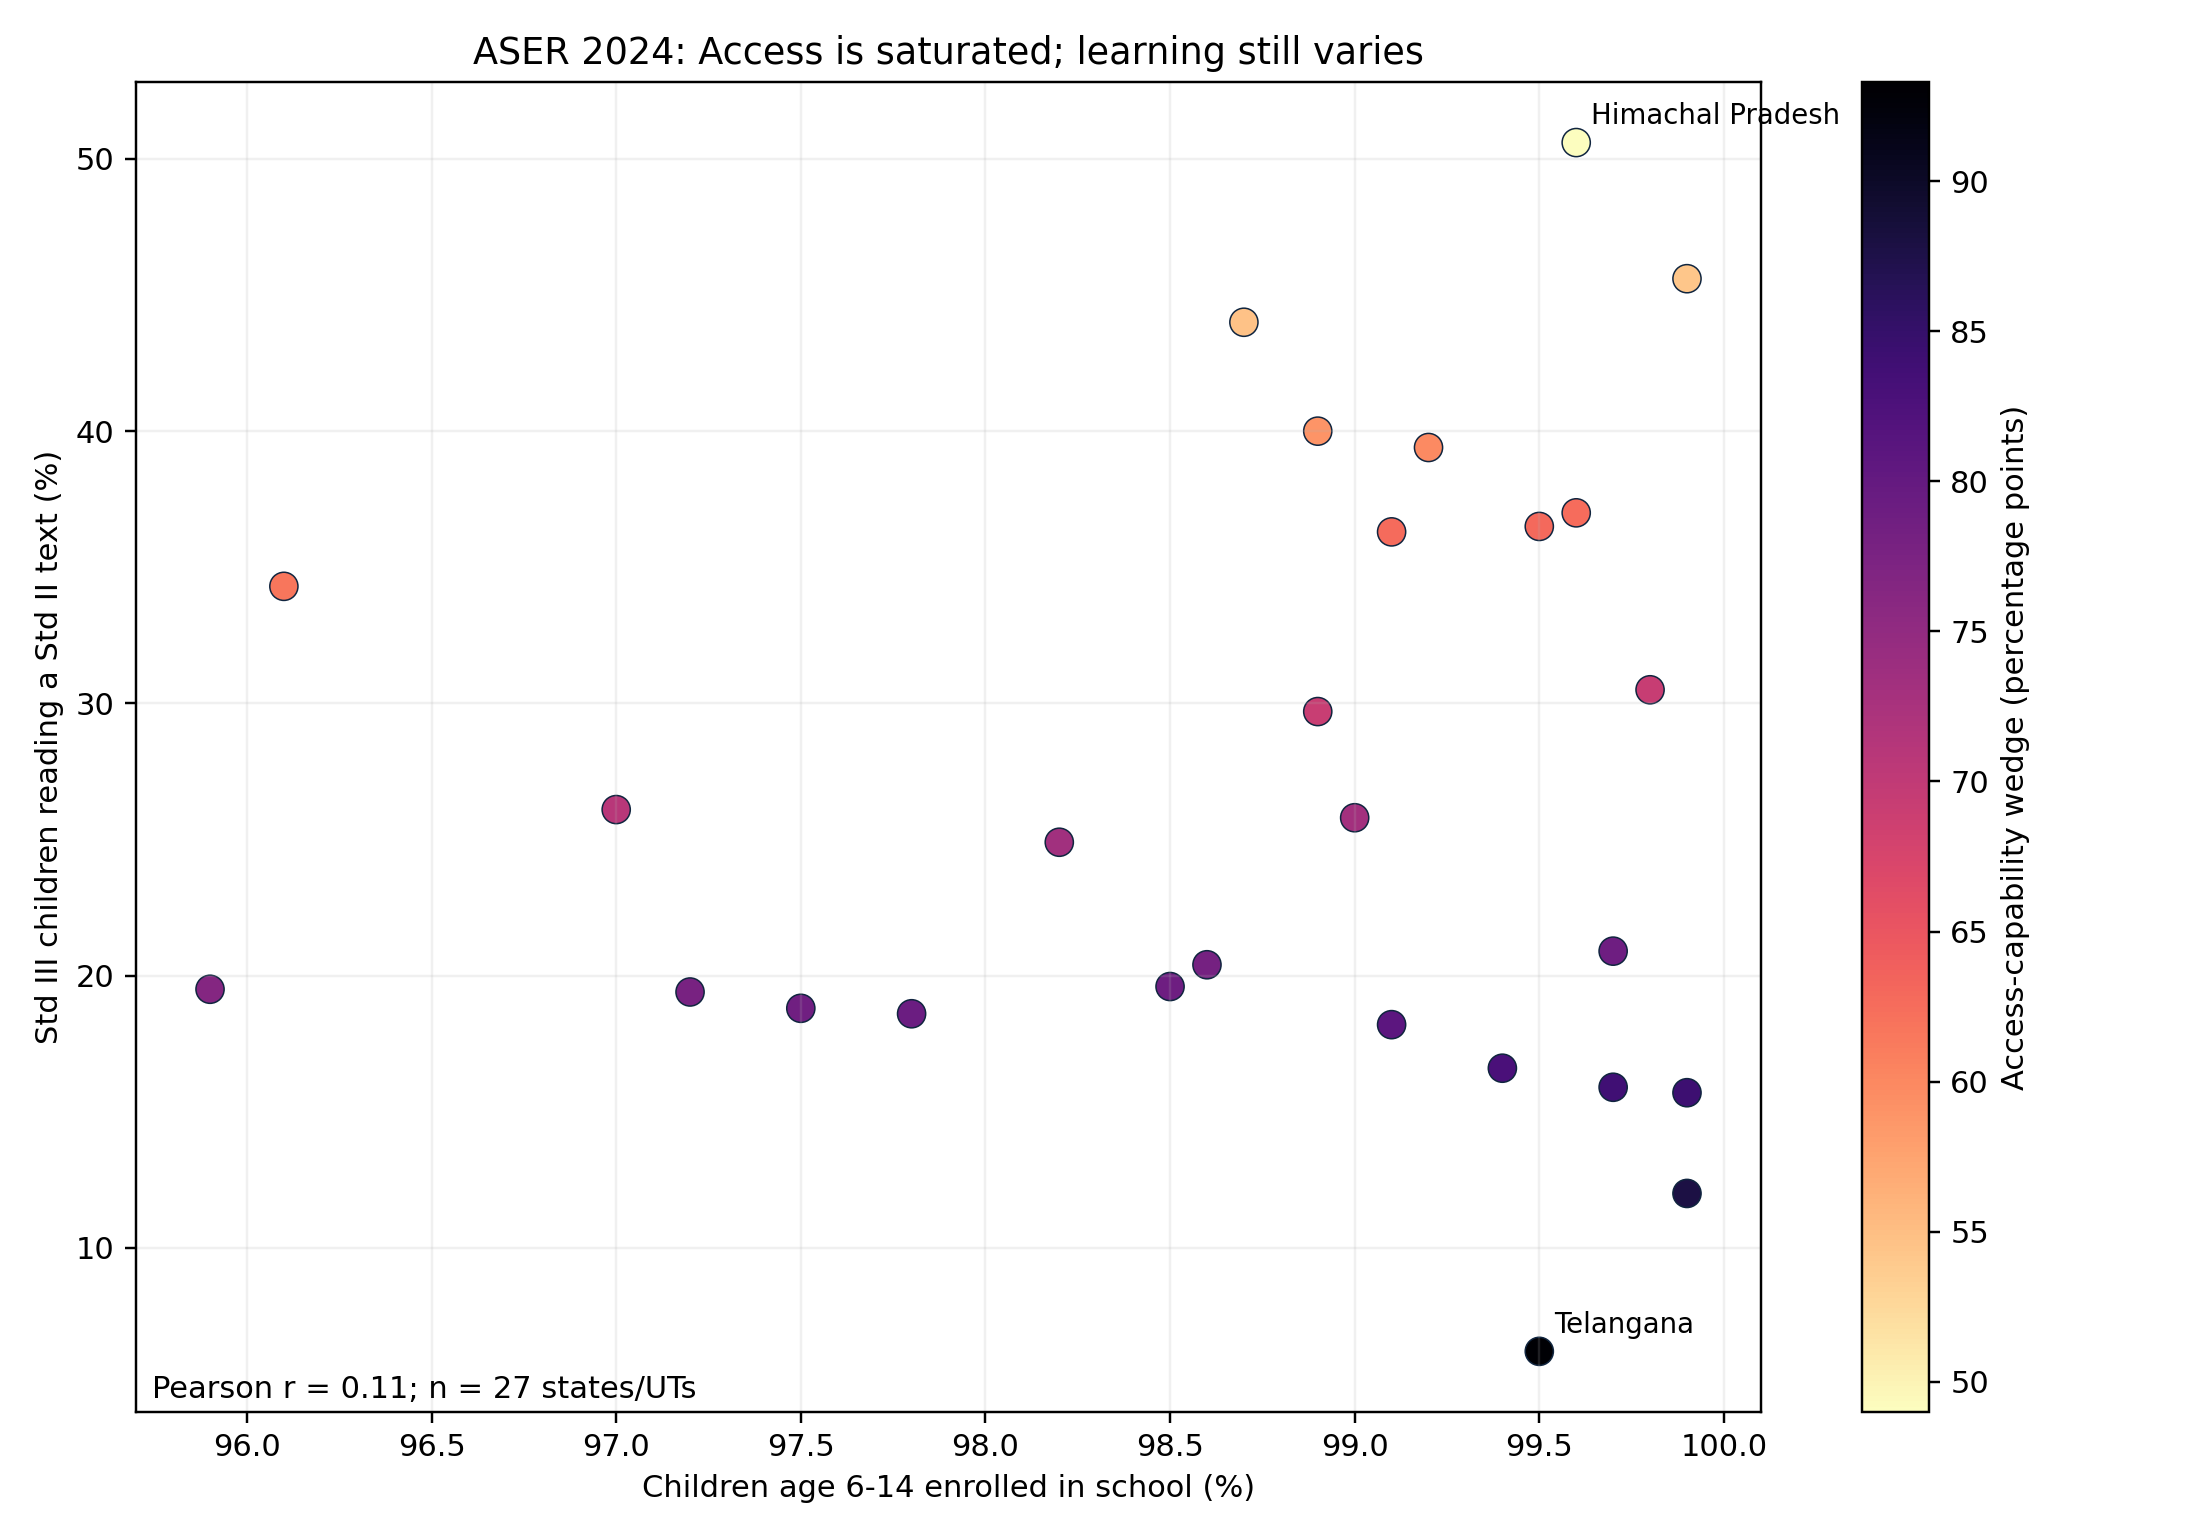
That is stronger evidence than the earlier eight-state exploratory run. In this full published panel, near-identical enrolment levels coexist with radically different learning outcomes. Enrolment remains necessary and worth celebrating. It has simply become a weak discriminator of whether the system is producing foundational capability.
This is the distinction the essay is built around: the photograph can be real, the achievement can be real, and the photograph can still omit the thing that compounds.
What the result does not prove
This is a descriptive, cross-sectional study of geographic aggregates. It does not estimate the causal effect of enrolment, rank school quality, explain why one state performs differently, or cover urban India. The proxy-capability wedge is an explanatory device, not a policy score or treatment effect.
It also does not turn one reading task into a complete definition of education. A proxy can fail without its proposed replacement becoming a perfect measure.
The second dashboard module applies the same discipline to enforcement statistics: 56 conviction outcomes equal 93.33% of 60 completed trials, 2.34% of 2,396 prosecution complaints, or 0.63% of 8,851 recorded ECIRs. Those ratios answer different pipeline questions. The aggregate data contain no party-coded case panel and therefore cannot, on their own, identify selective partisan enforcement. That claim requires verified case-level timelines, party status at the event date, stage transitions, outcomes, and a pre-specified comparison design.
In other words: a denominator is not a formatting choice. It is part of the claim.
Explore and reproduce it
The complete research package keeps the original essay, dashboard, 43-claim source tracker, exploratory study scripts, methods, extracted CSVs, full-panel analysis, results, and figures together.
The generalisation is now a data-engineering problem: construct a state-year panel linking UDISE+ enrolment, ASER learning, PLFS wages, MoSPI GSDP, and R&D allocation, utilisation, and output. Then test whether the proxy-capability wedge appears across domains - and publish the domains where it does not.
The point is still to be right, not loud.
Sources are footnoted throughout and compiled in the companion dashboard. Government data, court judgments, peer-reviewed papers, and named surveys only. Where a figure was contested, both sides are cited. Corrections welcome - the whole point is to be right, not to be loud.
-
India Brand Equity Foundation, Economic Survey / MoSPI GDP and GST figures, FY25–26. ↩
-
Das & Drèze, Labour Bureau Wage Rates in Rural India series; summarised in “The Long Stagnation of Indian Wages,” Countercurrents, 2026. ↩ ↩2
-
SBI / Nifty 500 profit-to-GDP analysis, FY24; reported via The Federal year-end economy review 2025. ↩ ↩2
-
CEDA, Ashoka University, “The Indian GDP Trajectory: U, V, W or K-shaped?”; World Inequality Report 2026. ↩
-
Employment-elasticity decline post-1991; PLFS and Economic Survey data; Vajiram/Drishti IAS jobless-growth analyses. ↩
-
ASER 2024 National Findings, ASER Centre / Pratham. Note: 23.4% (Class 3 reading), 44.8% (Class 5 reading) and 30.7% (Class 5 division) are government-school figures as stated in the report; 27.1% (Class 3 reading, all schools) and 33.7% (Class 3 subtraction, all-India) are the all-children figures. Labelled accordingly above. ↩ ↩2
-
UDISE+, Ministry of Education, enrolment and infrastructure data. ↩
-
ASER 2024; NEP 2020 Foundational Literacy and Numeracy (NIPUN Bharat) implementation data. ↩
-
Johnson & Parrado (2021), “Assessing the assessments,” on NAS/ASER reliability (PMC8246517). ↩
-
Aspiring Minds National Employability Report; widely cited ~80% figure. ↩
-
Unstop Talent Report 2025; India Skills Report 2025 (Wheebox/AICTE/AIU/CII). ↩
-
State of Working India 2026, Azim Premji University. ↩
-
Ganguli et al., “Top Talent, Elite Colleges, and Migration: Evidence from the IITs,” Journal of Development Economics / NBER. ↩
-
MBBS emigration estimates; MEA Lok Sabha replies; Deccan Herald “Stop the Talent Drain.” ↩
-
OECD International Migration Database; highly-educated migrant stock. ↩
-
MEA reply, Lok Sabha Q.894; World Bank “India’s Great Student Out-Migration.” ↩
-
Henley Private Wealth Migration Report 2023–2025. ↩
-
Knight Frank Wealth Report; CNBC “Inside India” HNWI survey. ↩
-
Compiled HNWI migration surveys; TerraTern, CNBC, Business Standard. ↩
-
Stanford 2025 Global AI Vibrancy Tool. ↩
-
IndiaAI Mission GPU deployment figures, 2025; WION, Education for All in India. ↩
-
ORF, “India in the AI Race: Why Compute Will Decide Power.” ↩
-
NFAP (Stuart Anderson), “Immigrants and US Billion-Dollar Companies,” 2026. ↩
-
Institute for Progress, analysis of Forbes AI 50 (2025); CSET/Georgetown on student-visa origin. ↩ ↩2
-
Stanford VC Initiative (Strebulaev), immigrant unicorn-founder analysis. ↩
-
Economic Survey 2025-26 on GERD; Forbes India, Business Today. ↩
-
GERD decline from ~0.90% (2008) to 0.64%; SabrangIndia/NewsClick; arXiv 2411.15045. ↩
-
Economic Survey on private-sector R&D share. ↩
-
CEA citing Lazonick (HBR) on financialisation; Plutus IAS. ↩
-
Asia Times, “India’s R&D crisis isn’t a money problem,” on researcher density and diaspora. ↩ ↩2
-
ANRF Act 2023; Union Budget 2026-27 RDI fund allocation. ↩
-
RDI fund utilisation (~15% of prior allocation); Plutus IAS / Budget 2026-27 coverage. ↩
-
UPI/NPCI volume data; BHASHINI inference figures; Economic Survey publication rankings. ↩
-
Association for Democratic Reforms v. Union of India, judgment 15 Feb 2024; Article 19(1)(a). ↩
-
Stimson Center, “India’s Electoral Bond Conundrum,” on 56% of political funding. ↩
-
ADR analysis; ECI-disclosed data; BJP ~48% of bonds / ~90% of corporate bond donations; ~₹16,518 cr encashed. ↩
-
SC Constitution Bench, “quid pro quo” warning, 15 Feb 2024. ↩
-
Ministry of Finance reply, Rajya Sabha, 2025: 193 cases, 2 convictions. ↩
-
The Wire, on <5% PMLA conviction rate since 2019 (42 of 911); govt reply to Randeep Surjewala. ↩
-
Indian Express investigation; 14-opposition-party SC plea; opposition share 54%→95% post-2014. ↩
-
V-Dem Democracy Report 2025; electoral-autocracy reclassification; judicial-autonomy decline. ↩
-
Freedom House, Freedom in the World, “Free”→”Partly Free,” 2021. ↩
-
RSF World Press Freedom Index, rank 150→161. ↩
-
Journal of Democracy, “Why India’s Democracy Is Dying,” 2024. ↩
After the last line
Comments & sharing
Agree, disagree, add context, or send this to someone who would have a take.
Share
Public thread
Comments are public and attached to this post through GitHub Discussions. Sign in with GitHub to join the thread.
Open public discussions