Key takeaways BLUF: SignalGraph treats stars as one noisy popularity feature, then combines event timing, account quality, coordination patterns, maintenance, adoption, and durability into a more defensible open-source trust signal.
- GitHub stars are widely used as a shorthand for project quality and traction, but they are increasingly vulnerable to manipulation. Kapravelos
- A recent CMU-led ICSE 2026 paper found that 16.66% of repositories with at least 50 stars in a July 2024 cohort showed fake-star campaign activity. Kapravelos
- I am developing SignalGraph to detect suspicious starring behavior and replace raw star count with stronger trust signals.
- The bigger opportunity is not just fraud detection, but a new diligence layer for VCs, accelerators, and technical buyers.
1) The Problem with GitHub Stars as Social Proof
GitHub stars were never meant to be a perfect measure of product quality, customer adoption, or technical durability. GitHub itself frames stars as a way to save repositories and signal interest, which is useful, but also easy to over-interpret when people start using the count as shorthand for credibility. GitHub Docs
That over-interpretation matters because open-source ecosystems now sit inside real investment, hiring, procurement, and dependency-selection workflows. A repo with a large star count often gets treated as:
- more legitimate
- more battle-tested
- more loved by developers
- more worthy of investor attention
- more likely to be a breakout company
But popularity signals are only useful until they become gameable.
That is exactly the issue highlighted by the recent CMU-led research paper “Six Million (Suspected) Fake Stars on GitHub: A Growing Spiral of Popularity Contests, Spam, and Malware.” The study argues that GitHub star counts are increasingly subject to artificial inflation, reducing their value as a decision-making signal and, in some cases, creating a real supply-chain and security problem. Kapravelos
2) What the Research Suggests
The paper introduces StarScout, a large-scale system built to detect suspicious GitHub starring behavior across GHArchive data from 2019 to 2024. StarScout relies on two core signatures:
- low-activity accounts
- lockstep/coordinated starring behavior Kapravelos
The findings are hard to ignore:
- fake-star-related activity surged sharply in 2024
- the detected accounts and repositories tended to have trivial activity patterns
- many suspicious campaigns were associated with short-lived phishing or malware repositories
- the remaining activity often promoted AI/LLM, blockchain, tool/application, and tutorial/demo repositories
- fake stars provided only short-term promotional benefit and became a long-term liability afterward Kapravelos
Most importantly for product design, the paper reports that 16.66% of repositories with at least 50 stars in a July 2024 cohort showed fake-star campaign activity. It also reports 18,617 repositories involved in fake-star campaigns after postprocessing, with roughly 301,000 accounts and about 6.0 million suspected fake stars identified at scale. Kapravelos
This is the key insight:
GitHub stars are still useful as visible popularity, but no longer reliable enough to be used alone as a trust signal.
3) The Real Opportunity
A lot of people will read that paper and think the product opportunity is obvious:
build a fake-star detector.
That is useful, but it is not the whole opportunity.
The bigger opportunity is to build a system that says:
“Here is the difference between visible popularity and credible traction.”
That is the basis for SignalGraph.
I am developing SignalGraph as a platform with two layers:
-
Detection layer
Detect suspicious or coordinated star activity. -
Replacement signal layer
Build a credibility-adjusted trust score for open-source repositories.
In other words, instead of telling users only that a repo may be suspicious, the system should answer a more valuable question:
What should we trust instead?
4) SignalGraph: Core Product Idea
SignalGraph treats GitHub stars as one observable input, not the final truth.
The platform would produce a set of scores for any repository:
- Manipulation Risk Score
- Star Integrity Score
- Adoption Score
- Builder Quality Score
- Durability Score
- Credibility-Adjusted Traction Score
The goal is to separate:
- attention
- trust
- usage
- execution quality
- staying power
A repository might have:
- high raw stars
- low star integrity
- low downstream adoption
- decent builder quality
- weak durability
That paints a much more realistic picture than “12,000 stars.”
5) A Proposed Scoring Frame
A simple conceptual formulation could look like this:
[ CAT_r = w_1 I_r + w_2 A_r + w_3 B_r + w_4 D_r + w_5 P_r ]
Where:
- (CAT_r): credibility-adjusted traction for repository (r)
- (I_r): star integrity score
- (A_r): adoption score
- (B_r): builder quality score
- (D_r): durability score
- (P_r): raw popularity score
- (w_1, w_2, w_3, w_4, w_5): configurable weights, with raw popularity intentionally downweighted
This formulation matters because it avoids the trap of simply turning stars into a fraud classifier. Instead, it creates a more useful ranking system.
Research Artifact: Velocity and Credibility Adjustment
The first prototype artifact uses labeled synthetic star histories. That is intentional: authenticated starred_at data is the right production source, but it needs a GitHub token and careful rate-limit handling. The point here is to demonstrate the detection method without pretending the sample is a real GitHub finding.
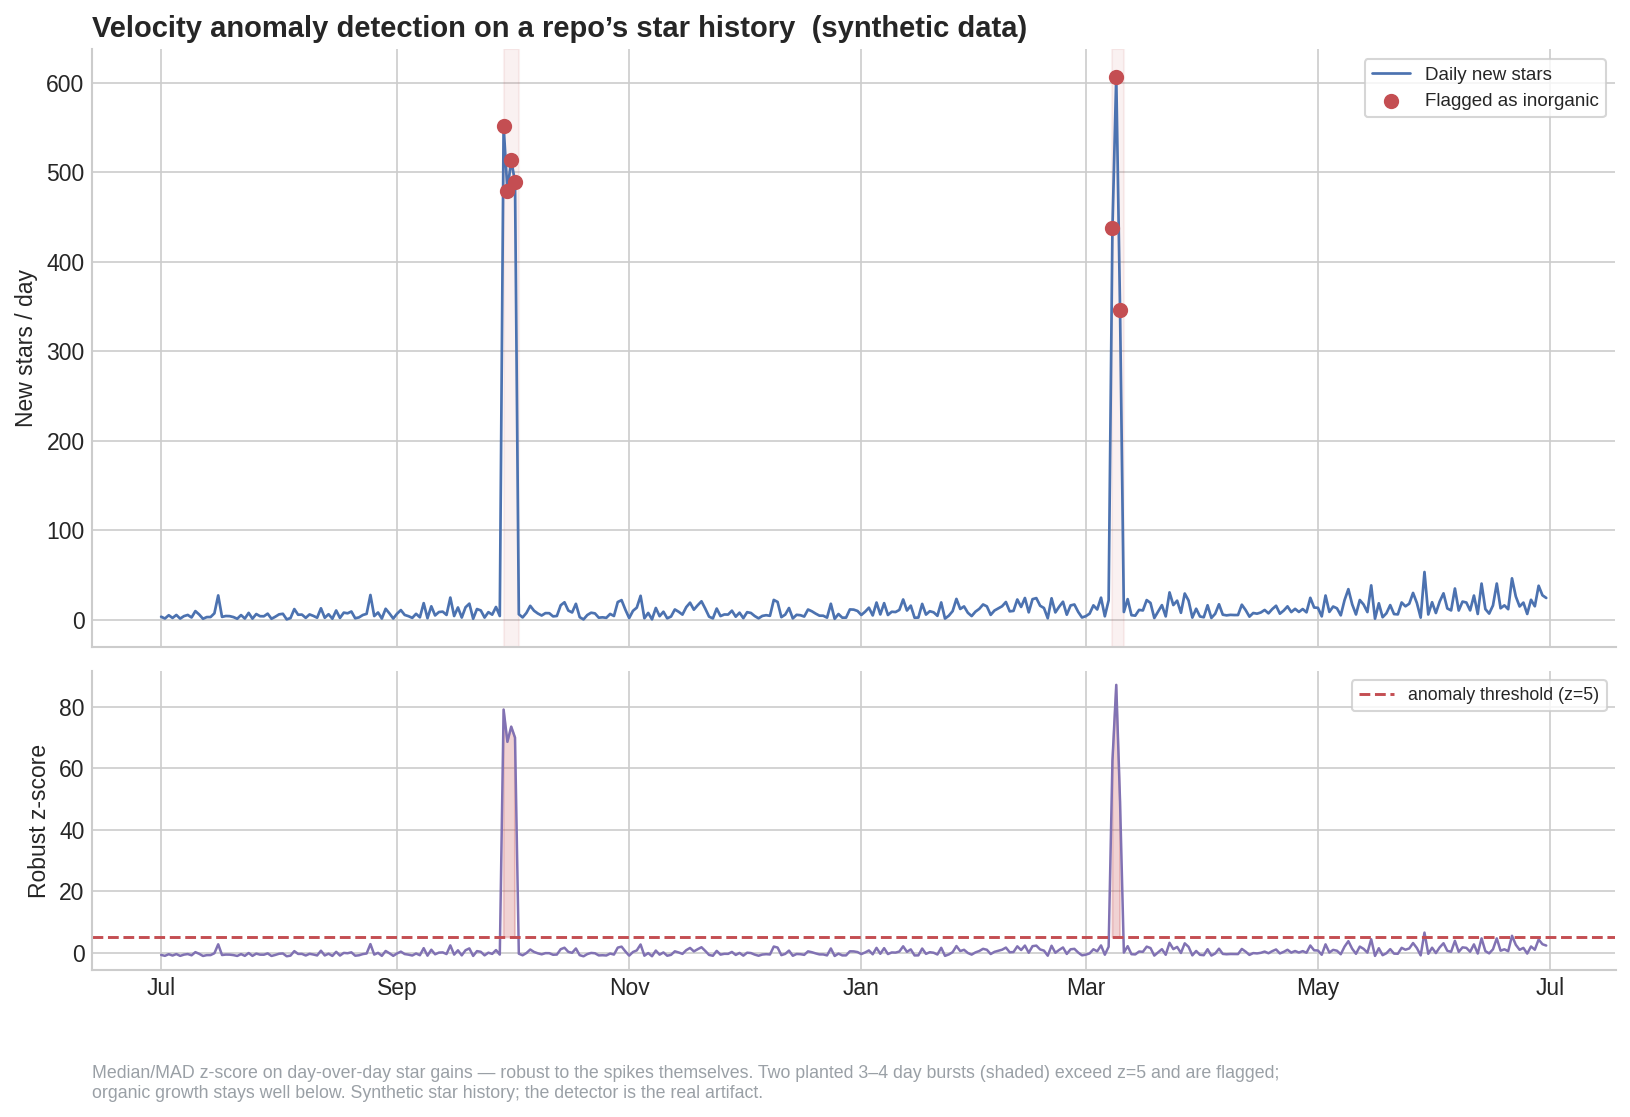
Synthetic data, real method: a robust median/MAD z-score catches two planted inorganic bursts and avoids false positives on the organic series.
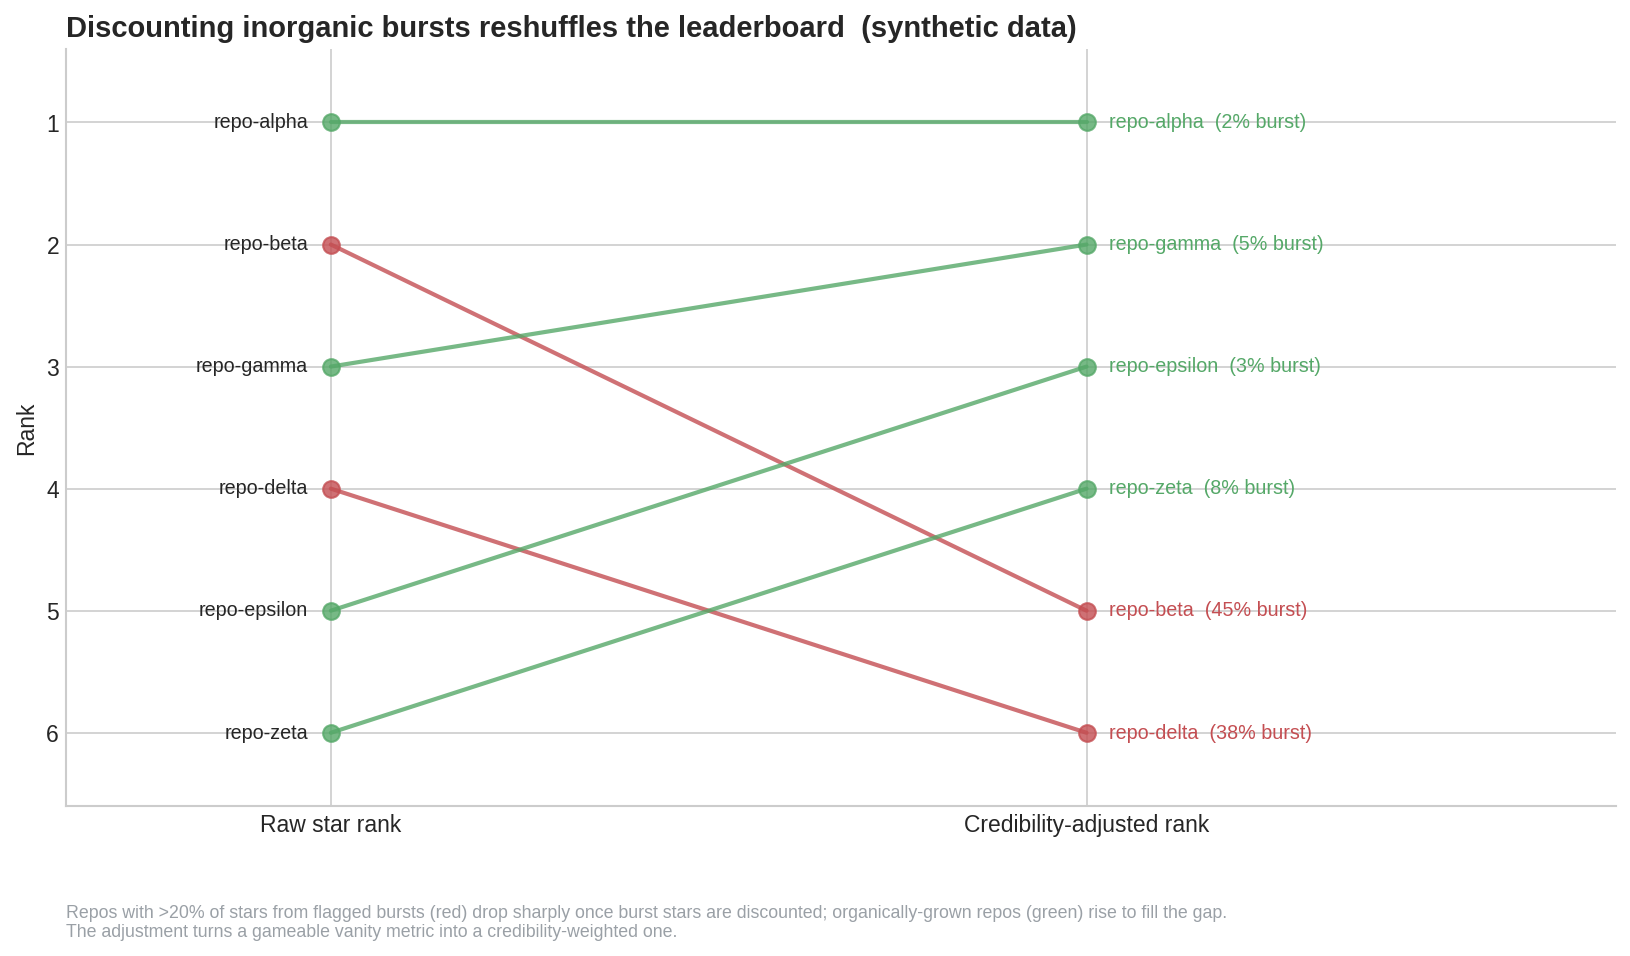
Synthetic data, real method: repos with more than 20% burst-sourced stars drop sharply once burst stars are discounted, while organic repositories rise to fill the gap.
5.1 Manipulation Risk Score
This score estimates whether the visible star activity shows suspicious patterns such as:
- extreme burst concentration
- stargazer accounts with very low non-star activity
- unusually synchronized starring windows
- abnormal stars-to-forks or stars-to-contributors ratios
- spikes that do not align with releases, commits, issue activity, or broader repo momentum
This is where the paper’s low-activity and lockstep ideas become especially useful. Kapravelos
5.2 Star Integrity Score
This measures how trustworthy the visible star count seems after adjustment.
A repo may have a high star count, but if a large fraction of those stars appear to come from:
- low-quality accounts
- tightly coordinated windows
- shallow activity footprints
then the visible count should not be treated as full-value social proof.
5.3 Adoption Score
Popularity is not adoption.
This layer would try to capture signals closer to real usage:
- downstream package references
- sustained forks
- active integrations
- external technical references
- ecosystem presence beyond GitHub vanity
The research paper itself emphasizes that stars are only a popularity signal and that prior work showed only moderate correlation with real usage or importance. Kapravelos
5.4 Builder Quality Score
A good repository is not just a popular one. It is maintained, iterated, and operationally alive.
Signals might include:
- release cadence
- contributor diversity
- issue responsiveness
- PR hygiene
- commit consistency
- maintainer continuity
5.5 Durability Score
Hype is not the same as staying power.
This score would track whether momentum survives over time:
- 30/90/180-day persistence
- continued updates after initial attention spikes
- sustained community engagement
- survival beyond trend windows
This is especially important because the CMU-led paper found that fake stars may provide a short-lived promotional effect but do not create durable long-term attention. Kapravelos
6) Why This Matters for VCs
There is a specific audience here that is under-discussed:
investors who increasingly use developer signals as part of diligence.
For seed and pre-seed funds in AI, developer tools, infra, security, and open-source software, GitHub is often treated like an ambient proof layer. A repo with a strong star curve may influence:
- partner perception
- founder narrative
- sourcing prioritization
- technical diligence
- benchmark comparisons against peers
But if the social proof layer is noisy, the investment workflow becomes noisy too.
SignalGraph would give VCs a more defensible decision surface:
Instead of:
- 14,000 stars
- looks hot
- probably worth a meeting
They get:
- elevated manipulation risk
- low star integrity
- moderate builder quality
- weak durability
- limited evidence of real adoption
That is a far more investable signal.
7) Why This Matters Beyond VC
This is not only an investor product.
Other users could benefit from a system like this:
7.1 Accelerators and incubators
Programs that benchmark early technical startups often need a way to compare founder traction without over-relying on vanity metrics.
7.2 Corporate technical diligence teams
Corp dev, platform engineering, or internal evaluation teams can use credibility-adjusted signals when deciding whether to engage with or depend on a project.
7.3 Security and supply-chain teams
If suspicious popularity campaigns are attached to spam or malware repositories, then popularity integrity becomes a security signal as well. Kapravelos
7.4 Open-source researchers
SignalGraph could become a way to study the gap between visible attention and actual repository health.
8) A Practical Build Path
A realistic MVP does not need to solve the entire GitHub graph immediately.
Phase 1: research-grade prototype
Start with:
- public repo metadata
- star event history where available
- simple anomaly features
- cohort-normalized comparisons
- scorecards for a fixed set of repositories
Phase 2: suspicious cluster analysis
Add:
- user–repo bipartite graphs
- time-windowed overlap analysis
- coordinated starring detection
- account-quality scoring
Phase 3: alternative trust layer
Add:
- adoption signals
- builder quality signals
- durability tracking
- repo-to-peer comparison views
Phase 4: workflow product
Add:
- watchlists
- diligence reports
- alerts
- API for portfolio monitoring
The key is that a useful product appears before perfect fraud attribution does.
9) Guardrails
A system like this has to be conservative.
The StarScout authors explicitly note that their detector identifies suspected fake stars and that false positives remain possible. That is important not only academically, but also product-wise. Kapravelos
So SignalGraph should never default to public accusations.
Its language should be:
- suspicious
- elevated risk
- likely coordinated
- confidence-limited
- unexplained activity pattern
That keeps the product useful without turning it into a reputation-destruction engine.
10) The Bigger Thesis
The deeper idea here is not just about GitHub.
It is about what happens when a social proof metric becomes important enough to game.
Once a metric enters:
- hiring
- distribution
- procurement
- funding
- status
it starts drifting away from what it originally measured.
That is why the best product here is not merely a detector of bad behavior. It is a replacement signal system.
GitHub stars tell us who got attention.
SignalGraph would try to tell us who earned trust.
11) Final Thought
Open-source ecosystems need metrics that are closer to reality than vanity.
If visible popularity is increasingly noisy, then the next useful infrastructure layer is not more hype ranking. It is credibility-adjusted ranking.
That is the ambition behind SignalGraph:
not just to catch manipulated traction, but to build a better way of reading technical momentum in public software ecosystems.
Related posts
This article is part of a three-part series on governance-layer AI: how systems make risk, provenance, and technical credibility reviewable.
- Aegis: an AI governance and privacy trust layer
- Wax Seal: human-legible provenance and tamper evidence
- Tracking AI-generated content through provenance
After the last line
Comments & sharing
Agree, disagree, add context, or send this to someone who would have a take.
Share
Public thread
Comments are public and attached to this post through GitHub Discussions. Sign in with GitHub to join the thread.
Open public discussions