1) Why Segmentation Matters Beyond Analytics
In public sector digital experience, “average user” is a misleading concept.
Two residents can submit the same request but experience very different outcomes because of:
- language and literacy barriers
- device constraints (mobile-only, limited bandwidth)
- trust and fear of “systems”
- accessibility needs
- time constraints and caregiving load
Segmentation makes these realities legible.
2) A Practical Segmentation Frame: Barrier-First, Not Demographic-First
A useful segmentation approach prioritizes barriers and behaviors over demographics.
2.1 Example Segment Feature Families (signals)
- Channel behavior: web vs phone vs in-person dependence
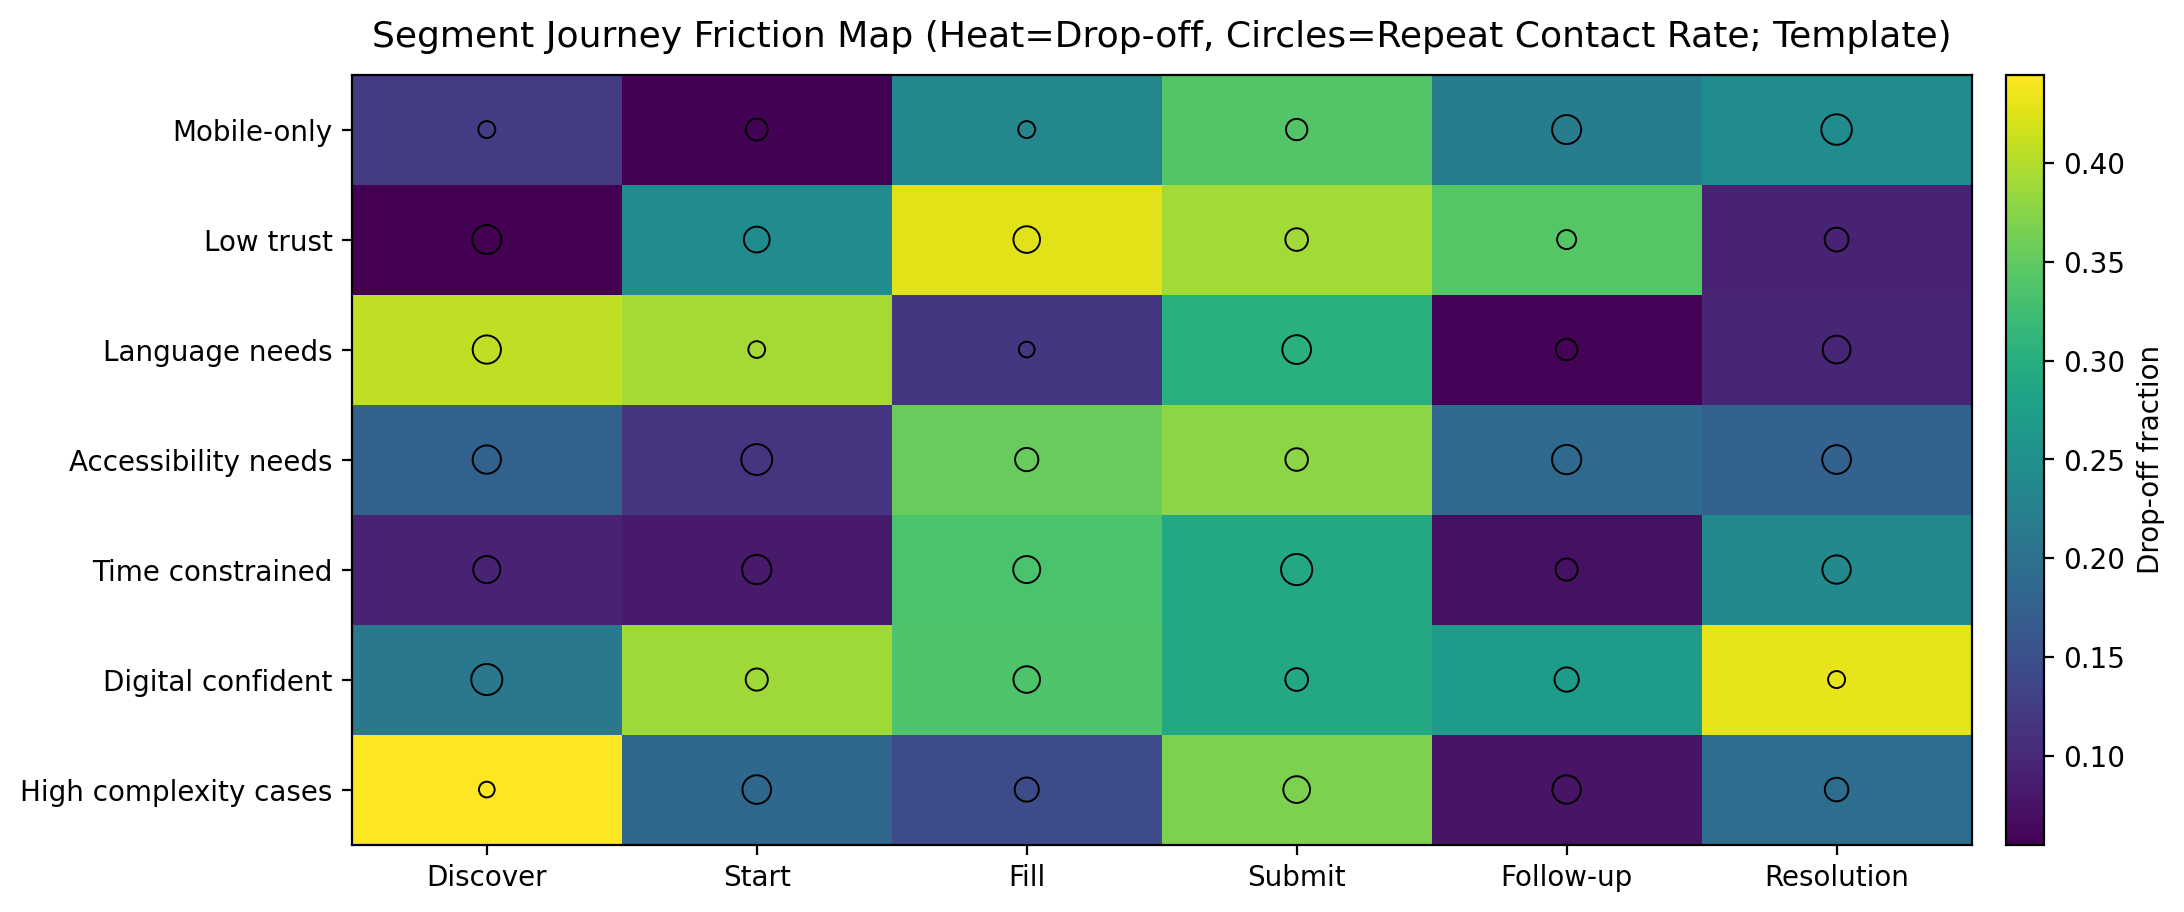
- Friction patterns: drop-off points, repeated contacts, time-to-completion
- Communication needs: language, readability, accessibility
- Trust signals: complaint patterns, avoidance of online forms, preference for human confirmation
- Context: neighborhood-level deprivation indices, service availability proxies (used carefully)
This keeps the segmentation actionable for DX teams, not just descriptive.
3) Methods: How to Build Segments That Survive Reality
3.1 Mixed-method segmentation (recommended)
- Qualitative discovery: interviews + journey mapping → hypothesize barrier clusters
- Quantitative confirmation: clustering / latent class analysis / topic models on service interactions
- Validation: stability checks + interpretability review with frontline staff
3.2 Example quantitative approaches
- Clustering on standardized friction + channel features (k-means / GMM)
- Latent class analysis for discrete barrier profiles
- Topic modeling on request text to link service needs to barrier patterns
- Rule-based “segment tags” first, then ML refinement (often best in government)
3.3 Segment quality tests (simple but effective)
- Stability across months
- Separation on key friction metrics (drop-off, repeats, complaint rate)
- Interpretability review: “Can a service owner explain this segment?”
4) The Operational Artifact: Opportunity Matrices and Service Overlay
Once segments exist, the high-value output is not the cluster plot - it’s the translation into decisions.
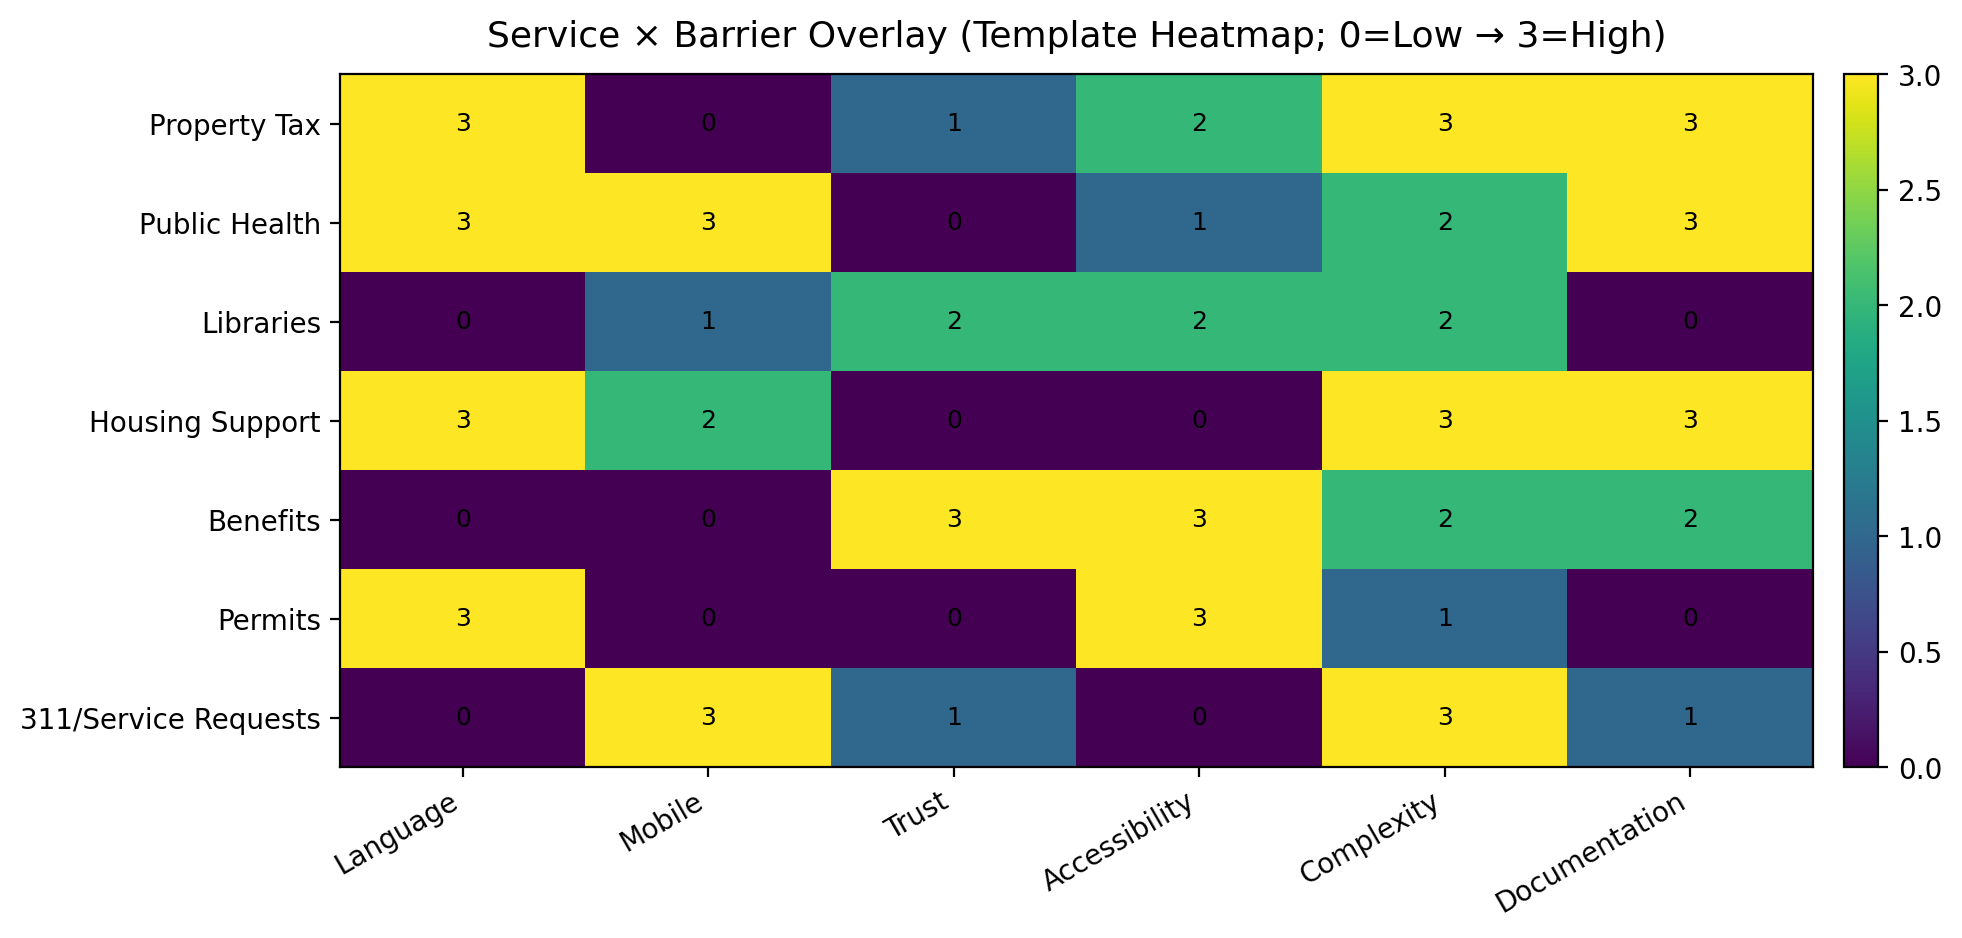
4.1 Pain Point vs Service Overlay Matrix
Create a matrix:
- Rows: Services (Property Tax, Public Health, Libraries, Housing, etc.)
- Columns: Barriers (Language, Mobile, Trust, Accessibility)
- Cells: intensity score (from outcomes + qualitative evidence)
This becomes:
- a prioritization tool for service redesign
- a hypothesis generator for pilots
- a measurement map for AI deployments
5) How Segmentation Links Directly to Responsible AI
This is the key bridge:
5.1 Segmentation becomes the “equity lens” for AI auditing
If you deploy AI-assisted routing, summarization, or extraction, you must measure outcomes by segment, not just globally.
For each AI-enabled touchpoint:
- override rate by segment (proxy for mismatch)
- error rate by segment
- time-to-service by segment
- complaint rate by segment
Segmentation provides the disaggregation layer required for monitoring.
5.2 Segmentation improves AI safety and performance
Segments can be used to:
- design tiered rollout: start with lower-risk segments/services
- define threshold policies: require review for high-friction segments
- improve prompting and retrieval: tailor knowledge snippets and language complexity
- improve human-in-the-loop routing: ensure escalation paths exist where trust is fragile
5.3 Avoiding the failure mode: “segmentation as profiling”
Guardrails:
- only use features that are defensible and relevant to service improvement
- avoid protected-attribute targeting unless explicitly permitted and reviewed
- keep a plain-language explanation of why segmentation exists and what it influences
- ensure segment tags are used for support, not exclusion
6) A Combined Implementation Pattern (Segmentation + AI)
Phase 1: Segmentation as measurement backbone
- define segment tags
- build dashboards disaggregated by segment
- establish baseline disparities (time/quality)
Phase 2: AI pilot with segment-aware monitoring
- deploy assistive AI (Tier 0/1) in one service area
- track outcomes overall + by segment weekly
- review overrides + complaints monthly
Phase 3: Scale what’s repeatable
- standardize segment-aware evaluation for every AI use case
- bake segment reporting into governance reviews
7) What I Learned
Segmentation doesn’t just “describe residents.”
Done correctly, it becomes:
- a service design targeting layer
- a measurement layer for auditing automation outcomes
- a safety layer for scaling AI responsibly
That’s the bridge between segmentation and AI integration: segments operationalize accountability.
https://hup.umn.edu/news/designing-digital-services-around-resident-needs-advancing-equitable-access-hennepin-county
https://hup.umn.edu/news/inside-hcra-students-journey-behind-research
After the last line
Comments & sharing
Agree, disagree, add context, or send this to someone who would have a take.
Share
Public thread
Comments are public and attached to this post through GitHub Discussions. Sign in with GitHub to join the thread.
Open public discussions