A note on timing Figures here are as of mid-June 2026, around the SPCX pre/early-listing window. These numbers - valuation, segment revenue, analyst fair values, financing arrangements - are days old and moving fast. Treat them as a snapshot, not a settled record; the argument is about how forecasts are built and checked, which outlasts any single day’s figure.
Key takeaways
- A headline like “$322B by 2030” is not one estimate - it is a chain of stacked assumptions, each multiplying the uncertainty of the last.
- Roughly 60–80% of a high-growth valuation lives in terminal value, governed by a denominator where a 0.5% move swings value 10–20%.
- Past forecasts missed hard in both directions: they undershot AI capability by 6–8x, yet today’s company-level revenue projections appear to overshoot monetization just as badly.
- This is not a bubble verdict. It is an argument for instrumenting the hidden variables before treating a high-variance prediction as a planning number.
It started with a number I couldn’t place.
Goldman Sachs, lead underwriter for the SpaceX IPO, told prospective investors that the company’s AI-related revenue would rise from $3.2 billion in 2025 to $322 billion by 2030 - a roughly 100-fold increase in five years. This is for a unit that, in the same filing, lost $6.36 billion on that $3.2 billion of revenue in 2025. The forecast underwrites a valuation near $1.75 trillion.
I’m a data scientist. I build and read predictive models for a living. My first reaction wasn’t “that’s wrong” - it was “where does that number physically come from, and what would I need to see to believe it?” That question turned out to be more interesting than the number itself, because once you start pulling on it, you’re no longer looking at one company. You’re looking at how an entire economy is being forecast - and whether anyone is checking the forecasts against what actually happened last time.
This isn’t a bubble op-ed. I genuinely don’t know whether this is a bubble. What I can do is open the machinery, show how these projections are constructed, stress-test the SpaceX number against its own filings, and then ask the question almost no one asks: when we made forecasts like this three, five, eight years ago, how did they do?
The answer to that last one surprised me.
1) How a Forecast Like This Is Actually Built
A headline like “$322B by 2030” is never a single estimate. It’s the output of a chain of models stacked on top of each other, and each link multiplies the uncertainty of the one before it.
Layer 1 - Market sizing (TAM). Someone estimates how big the addressable market will be. This is where the dispersion starts, and it’s worse than most people realize. For generative AI in 2025 alone - a year that has already happened - published market-size estimates range from about $22B (Grand View) to $37.9B (Precedence) to $53.7B (Global Market Insights) to $71.4B (MarketsandMarkets). That’s a 3.2x spread on a number that should already be observable. If analysts can’t agree on the size of a market that exists right now, the 2030 figure is not measurement - it’s extrapolation dressed as measurement.
Layer 2 - Capture rate. Once you have a giant TAM, you assume a company captures some slice of it. This is where huge revenue lines appear cheaply: a few percent of a multi-trillion-dollar market is a very big number. But “a few percent” is now bundling competitive position, pricing power, and execution into one assumed constant.
Layer 3 - Capacity and utilization. AI revenue is bound to physical infrastructure - chips, data centers, power. So the model assumes a buildout and assumes that buildout gets used. Utilization is the quietest, highest-leverage input in the whole stack: at high utilization, infrastructure is a platform; at low utilization, it’s stranded cost depreciating on the balance sheet.
Layer 4 - Pricing. The most fragile input. AI usage can rise while revenue per unit falls - inference costs drop, open-weight models improve, competitors undercut. Volume growth and value capture are not the same variable, and forecasts routinely conflate them.
Layer 5 - Margin. What does one unit of output cost to produce, including GPU depreciation, energy, networking, human review, support, compliance? Omit these and you’re modeling a revenue story, not an economic one.
Put together, the revenue layer can be written compactly:
R = (C · U) · q · p · s

  C = installed capacity     U = utilization
  q = output per unit        p = realized price
  s = share of workload won

  R_observed = min(R_demand, R_capacity)
Layer 6 - Valuation. Finally the cash flows get discounted to present value via a discounted cash flow (DCF) model. Here’s the technical detail that matters most, because it’s where the fragility concentrates.
In a DCF, value splits into an explicit forecast period (usually five years) and a terminal value representing everything after. For a high-growth company, terminal value typically accounts for 60–80% of the total valuation - and in a five-year DCF specifically, around 75%. The terminal value uses the Gordon Growth formula:
TV = FCF × (1 + g) / (WACC − g)
Look at the denominator: WACC − g. The long-term growth rate g is subtracted from the discount rate, so as g approaches WACC, the denominator shrinks toward zero and the value explodes. This is why analysts note that a change of just 0.5% in g can swing terminal value by 10–20%. The majority of a trillion-dollar valuation rests on the assumption most exposed to small errors. That’s not a flaw in any one model - it’s a structural property of the method everyone uses.
So when you see “$1.75 trillion,” understand what it is mechanically: a near-term revenue ramp you can partially check, sitting on top of a terminal value you can’t, governed by a subtraction in a denominator.
2) Stress-Testing the SpaceX Number Against Its Own Filings
The useful thing about the SpaceX figure is that, unlike most private-company projections, the S-1 gives us actuals to check it against.
The growth rate is extreme but precisely stated. $3.2B → $322B is a 100.6x increase, a compound annual growth rate of about 151% per year sustained for five years. Goldman’s disclosed path is steeper in shape than that average implies: it rises 388% to $15.6B in 2026, reaches $34.5B in 2027, then more than nine-folds between 2028 and 2030.
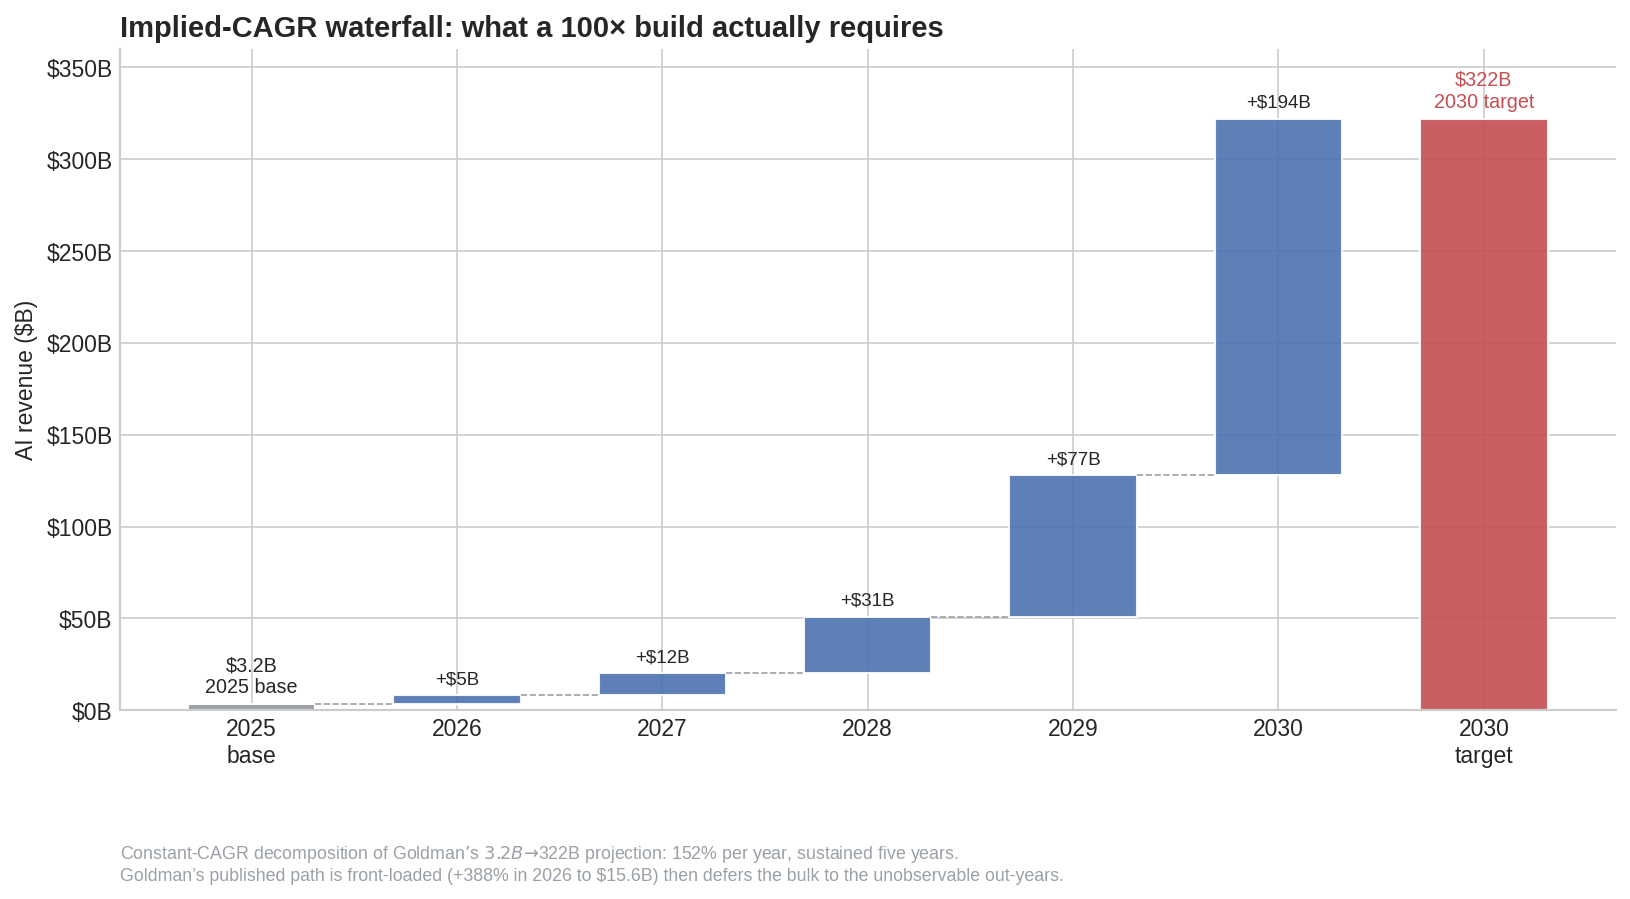 A constant-CAGR decomposition shows what the 100x build mechanically requires: the largest dollar lift lands in the least testable out-year.
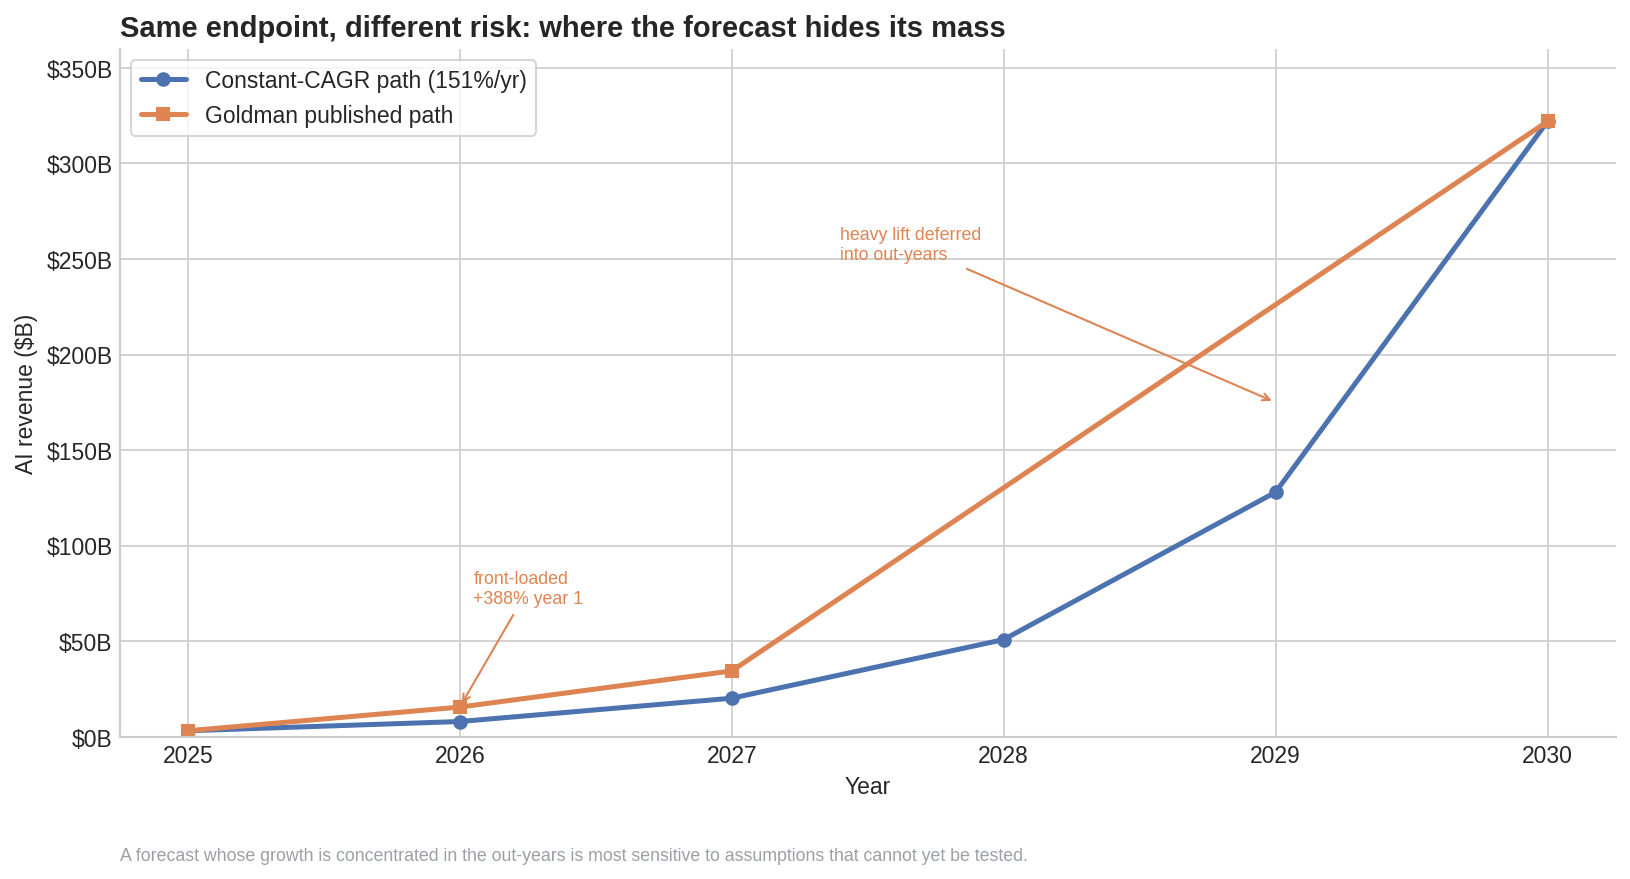 Both paths end at $322B, but the disclosed path front-loads year one and then defers the heavy lift into the out-years.
A forecast whose mass sits in the out-years is exactly the kind whose present value is most sensitive to assumptions you can’t check today.
The starting unit economics are deeply negative - and this is not hypothetical. In 2025, xAI lost $6.36 billion on $3.20 billion of revenue. The prior year it lost $1.56B on $2.62B - so the gap is widening. That’s an operating margin of roughly:
−6.36 / 3.20 ≈ −199%
Roughly two dollars lost per dollar of revenue. And the revenue base isn’t even mostly “AI infrastructure”: of the disclosed mix, $365M came from X and Grok subscriptions, $88M from data licensing, $116M from advertising - a large chunk is inherited social-media and ad revenue, not the compute-platform line the $322B is selling. The forecast therefore isn’t extrapolating a profitable engine; it’s asking you to believe a cost-structure regime change, not a trend continuation.
The capex commitment is enormous and reflexive. Of SpaceX’s $20.7B total 2025 capex, $12.7B went to AI infrastructure (the COLOSSUS Memphis cluster). Q1 2026 AI capex alone was $7.7B - a ~$30.8B annualized run rate. The $322B revenue line and the $30B/yr spend line aren’t independent: the spend is justified by the revenue forecast, and the revenue forecast requires the spend. The estimator is inside its own inputs.
How easily does it break? The common sensitivity table moves one variable at a time and looks survivable - a 25% price cut alone takes $322B to $242B. But in a real compression, price and utilization fall together (a glutted market is both cheaper and emptier), and they compound multiplicatively:
correlated downside: 0.75 × 0.85 = 0.64 → ~$205B
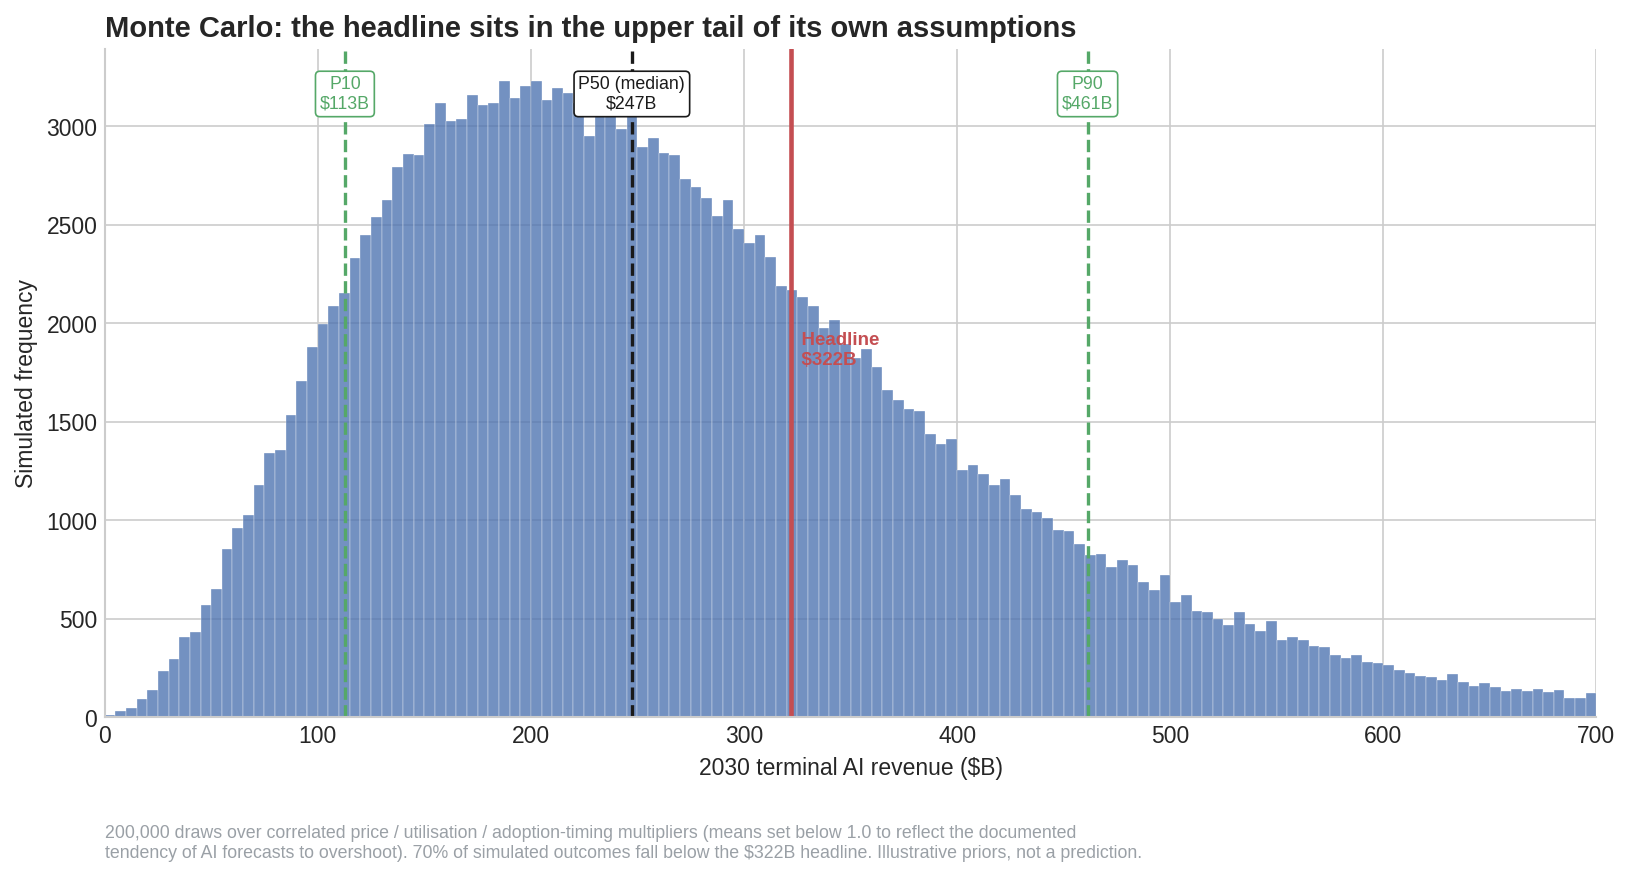 Drivers move together, so the downside multiplies rather than subtracts. In this illustrative Monte Carlo, the headline sits above the median and about 70% of simulated outcomes fall below it.
If five independent drivers each have an 80% chance of hitting their assumed value, the joint probability all five land is 0.8^5 ≈ 0.33. The base case is the upper corner of a distribution, not its center.
The independent check exists, and it’s far below the ask. This converts “I’m skeptical” into something verifiable: Morningstar assigned SpaceX a fair value of $780 billion - under half the ~$1.75 trillion IPO valuation - anchoring to Starlink and launch revenue and weighting the AI segment across scenarios, while calling xAI a “material threat of value destruction” with an “economic moat indeterminate.” When the underwriter and an independent analyst differ by roughly $1 trillion on the same company, that gap is the uncertainty band the headline omits.
3) The Check Almost No One Runs: Did the Old Forecasts Hold Up?
Here’s where I expected to confirm the cynical story - “forecasters always overshoot, it’s all hype.” The data doesn’t support that clean narrative, and the truth is more unsettling than the cynical version.
Forecasts have missed hard in both directions.
They have wildly under-shot. In 2017, a widely cited market report projected global AI revenue reaching $38.8 billion by 2025. Actual 2025 AI market estimates land around $244B (Statista) to $298B (IDC) - the 2017 forecast undershot reality by roughly 6 to 8x. On capability it’s starker still: in 2021, expert and superforecaster panels predicting ML benchmark performance underestimated progress so badly that the true result landed in the far right tail of their distributions - on the MATH benchmark, actual accuracy hit 50.3% against a 12.7% prediction. The people whose job is calibrated forecasting weren’t just wrong; they were wrong by margins their own confidence intervals had ruled out.
They have also wildly over-shot - at the company level, right now. The same era’s company-level revenue projections look very different from the market-level ones:
| Signal | Figure |
|---|---|
| OpenAI 2025 revenue | ~$13B |
| OpenAI 8-year capex commitments | ~$1.4 trillion |
| OpenAI projected 2028 operating loss | ~$74B (single year) |
| Deutsche Bank est. cumulative 2024–2029 losses | ~$140B |
| Enterprise GenAI pilots with no measurable return (MIT) | 95% |
So the honest synthesis isn’t “forecasts are hype.” It’s worse for the forecasting enterprise: the same methods that catastrophically underestimated the technology’s capability are now producing company-level revenue projections that may be catastrophically overestimating monetization. Underestimating the curve and overestimating who captures the money aren’t contradictory - they’re the signature of a field measuring the wrong variable. Capability scaled faster than anyone modeled; value capture is where the models now appear unanchored.
4) The Circularity Problem: Is the Demand Even External?
There’s a structural reason company-level AI revenue is hard to verify, specific to this cycle. A large share of the demand is internal to a small loop of firms.
By 2026, analysts have identified more than $800 billion in “circular financing” arrangements across the AI supply chain: chipmakers and clouds invest in AI labs, which spend that capital buying the investors’ own chips and cloud capacity. Nvidia announced it would invest up to $100B in OpenAI, which buys cloud from Oracle, which buys chips from Nvidia, which holds a stake in CoreWeave, which sells infrastructure to OpenAI. Microsoft and Nvidia put ~$15B into Anthropic, which committed ~$30B to Microsoft cloud and Nvidia chips. Michael Burry - of The Big Short - has publicly compared the vendor-financing structure to Enron’s pre-collapse accounting.
The concern, stated precisely: these arrangements can make demand look organic and revenue look robust when a meaningful fraction is the same dollars cycling among a handful of interconnected balance sheets. For a forecaster, this is a measurement nightmare - it contaminates the very ground-truth signal (third-party revenue) you’d use to validate a projection.
The bull case is real too: railroads, telecom, and earlier compute build-outs all used suppliers financing customers to bootstrap genuine markets, and inference demand from outside the circle is rising. But “we can’t cleanly separate external demand from internal recycling” is precisely the condition under which you should widen your error bars, not narrow them.
5) Do These Numbers Make Sense? And What’s Actually at Risk?
Let me answer the way I’d answer on a model-review committee.
Do they make sense? As possibilities, yes - none of the arithmetic is impossible. As point estimates marketed as base cases, no. The SpaceX figure is a high-variance prediction being communicated as a planning number. The tell isn’t the size of the number; it’s the absence of a falsification condition. A real forecast states what evidence would revise it down - slower utilization, faster price compression, negative gross margin after compute, weak pilot-to-renewal conversion, open-weight substitution. Each maps to a specific term in the decomposition above. When those conditions are missing, you don’t have a forecast; you have a narrative with numbers attached.
How well-guarded are the actual results? Poorly, in the specific sense that matters: the inputs with the most leverage (utilization, realized price, terminal g) are the least disclosed, and a portion of the demand signal is circular. The results aren’t fraudulent - they’re under-instrumented.
Is there systemic risk - to economics, social science, and technology itself?
- Economic. If capex is mistaken for productivity, we mismeasure the recovery. Spending $30B/yr on data centers raises investment activity regardless of whether durable output improves. S&P Global has modeled scenarios with ~2.5 million jobs affected in a full unwind; the Bank of England, IMF, and WEF have all issued cautions. Conversely, Jerome Powell notes these firms generate real revenue (unlike 1999), and corporate cash flow is triple its dot-com-era level - so this is a risk, not a verdict.
- Social-scientific. If “AI was deployed” becomes the success metric instead of “cost per task fell” or “errors dropped against a pre-AI baseline,” we measure participation in a cycle rather than impact. The 95%-no-return finding is exactly what proxy-metric drift looks like.
- Technological. When valuations depend on a specific future, engineering organizes around proving that future - demos, benchmarks, deployment volume - rather than the unglamorous reliability work (data quality, monitoring, evaluation, cost control) that determines whether AI becomes durable infrastructure or expensive theater.
6) The Irony I Can’t Get Past
I work on prediction systems. We spend enormous effort tightening them - cross-validation, held-out tests, calibration, distribution-shift monitoring - precisely because we know how they fail. And the AI economy is now being forecast using the exact failure modes we discipline against in our own models.
| Failure mode in ML | Its equivalent in these forecasts |
|---|---|
| Distribution shift | Market behavior changing faster than the baked-in assumptions |
| Sparse ground truth | Thin audited revenue/margin data; much of it loss-making |
| Proxy-metric drift | TAM, run-rate, capex standing in for realized, retained revenue |
| Overfitting | A path shaped to fit the investment narrative, not the trend |
| Feedback loops | Valuation altering the behavior of the firms being valued |
| Selection bias | Successful deployments far more visible than abandoned pilots |
| Measurement error | Revenue, ARR, run-rate, gross billings mixed together |
| Unobserved confounders | Regulation, power limits, open-weight substitution, circular demand |
We’re building an economy around prediction systems while declining to apply prediction discipline to the economy around them.
So maybe the next serious version of this conversation shouldn’t open with how large the market could be. It should open with a model card for the forecast: What’s the target variable? What’s directly observed versus inferred versus assumed? Where is sensitivity highest? What are the failure modes? What evidence updates the model - and what evidence breaks it?
7) Closing Thought
Until those questions are answered, I’d hold the biggest AI numbers the way I hold any high-variance prediction in a reflexive system: not as lies, not as destiny - as estimates with error bars wide enough to matter, where the cost of being wrong is paid not only by investors, but by workers, institutions, and the direction of the technology itself.
I’m genuinely curious where people who build or read these models would push back. If you had to instrument one hidden variable in these forecasts - utilization, realized price, or terminal growth - which would you demand first?
Sources
SpaceX S-1 / Financial Times reporting on the Goldman projection and xAI financials; Morningstar fair-value analysis; IDC, Statista, Gartner, and multiple research firms on AI market size; Damodaran and standard DCF references on terminal-value sensitivity; the MIT enterprise-AI pilot study; Bloomberg, Bernstein, and GMO reporting on circular financing; S&P Global, Bank of England, IMF, and WEF risk commentary; Jacob Steinhardt’s benchmark-forecasting experiment. Figures as of mid-June 2026 and moving quickly.
I’m a data scientist, not a financial advisor - this is analysis and exploration, not investment advice.
Further Directions
- build a “model card for forecasts” template that surfaces hidden assumptions before a number is published
- score published market-size estimates against eventual actuals to measure analyst calibration over time
- separate external from circular demand in reported AI revenue using supply-chain graph analysis
- stress-test terminal-value assumptions with a g/WACC sensitivity surface rather than a point estimate
- track pilot-to-renewal conversion as the leading indicator of real monetization
After the last line
Comments & sharing
Agree, disagree, add context, or send this to someone who would have a take.
Share
Public thread
Comments are public and attached to this post through GitHub Discussions. Sign in with GitHub to join the thread.
Open public discussions